Test Analytics Overview
Test Analytics is an added tool that comes with Smart Reader. Test Analytics is for analysis on the various test conducted in your institute, it directly import data from Smart Reader database or it can import data from some other database also.
Test Analytics prepares various report from the data captured from the OMR form and gives you text and graphical reports. The reports can be exported to MS-Word or MS-Excel. The reports can also be viewed by students/parents online with Online Test Analytics which provide students/parents same test reports online.
Test Creation:
You can create various tests and keep their records and retrieve them as desired. You can also create the section in the test like 1-50 Physics, 51-100 Chemistry etc. Now you can get subject wise topper and rank details.
Data Import:
Test Analytics can import data from Smart Reader database and other database too. You can categories the data in two categories.
Reports:
- Test Report
- Subject Wise Test Report
- Individual Test Report
- Individual Subject Wise Test Report
- Each Question Percentage Report
- Comparative Analysis with Topper
- Percentage Test Report
Online Test Analytics:
Online Test Analytics publishes the result on web, the database is same used for Test Analytics. The student/parent can login to the website and view their performance in the entire tests conducted. Following are the reports available.
- Subject Wise Detailed Report
- Total Marks Report
- Subject Wise Percentile Report (Graph)
- Test Code Wise Report (Graph)
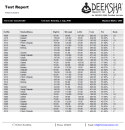
Test Report
With the help of this you can generate a report which will include the whole information about the stud ent which includes Student name, Roll number, Number of questions done right, Number of questions done wrong, Number of questions left, Total marks obtained, Percentage and Rank of the student. Thus, at a glance the faculty or student can have all the information.
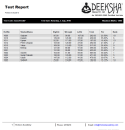
Individual test report
With the help of this you can generate the report for the individual student which includes Student roll number, name, test date, test code, right question, wrong question, left question, total marks, rank for each and every test given by the student selected. Thus you will be able to see the overall performance of the student.
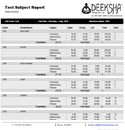
Subject Wise test report
With the help of this you can generate the subject wise test report which includes all the subjects in the particular test arranged in the proper order i.e, all the details with the particular subject comes together, then comes details of the next subject and so on. This, will help the faculty in comparing the result of the students via the subject name.
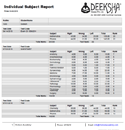
Individual subject wise test report
With the help of this you can generate a report for the student which includes the details of all subjects test given by him. Thus, by looking at the report the student knew in which all subjects he is weak, average or good and can thus give more attention to the weak subjects.
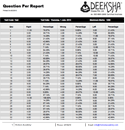
Question wise report
With the help of this you can generate a report which shows the status of answer given by a student for all the questions in a particular test. Thus, by looking at it the student knew whether the answer given by him for a particular question was right, wrong or he has left that question.

Each question percentage report
With the help of this you can generate a report which shows how many students have done the given question right, wrong or left it. Thus, by looking this report the faculty will be able to find out the status of the question i.e, whether the question is easy, moderate or tuf.
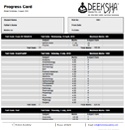
Progress Card
With the help of this you can generate progress card of the student for the specified time interval. This will help the parents to get the overview of his child performance for the time specified.
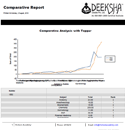
Comparative analysis with topper
With the help of this you can generate a report which compares the result of a particular student with the topper. Thus, by looking at this report student gets knowledge about his current status in the class.
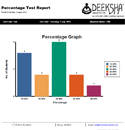
Percentage test report
With the help of this we can create a report which shows a graph showing how many students have scored marks between 0-10%, 10-20%, 20-30% etc. Thus by looking at this report the faculty will be able to get a view of the overall performance of the class.

Combined test report
With the help of this you can generate the combined test report for the two tests. This will help you to merge two tests data and then generate an equivalent report.


